You are here
Remote Sensing of Salinity Intrusions in Estuaries
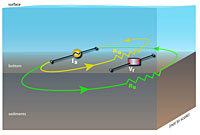
02/26/09 Portland, Ore.  Circuit Analog for Dipole Source on River BedThe NSF-funded Center for Coastal Margin Observation & Prediction (CMOP) has developed a new remote sensing device that opens the way for scientists to better understand and predict salinity intrusions in estuaries. Salinity intrusion is a process that occurs in all estuaries and affects sediments, microbial communities, primary productivity and fish habitats.
Oceanographer Thomas Sanford, Ph.D. and his team from the Applied Physics Laboratory at the University of Washington designed and built a bottom-mounted instrument for measuring electrical conductivity in the water column, which can be transformed into salinity readings.
The current process for measuring salinity involves sensors that provide “point” observations. Sanford’s instrument provides measurements of integrate salinities across the entire water column, allowing a more representative description of salinity intrusion and advancing associated characterization of gradients and trapping mechanisms.
Sanford’s approach is to produce a low-frequency electrical current and measure the resulting electric field at a nearby dipole receiver. The received electrical field is a function of the electrical conductivity of the water column and the sediments. (figure 1)
Sanford’s team deployed the system in Columbia River estuary before and during a flood tide. At the same time, they took measurements with a CTD, a standard oceanography-sampling device that reads conductivity, temperature and depth. As the layer of seawater thickened, they observed the decreased resistance of the water column caused the receiver voltage to decrease.
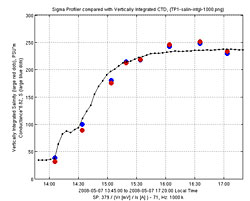
Previous studies in the Columbia River had demonstrated a tight correlation between electrical conductivity and salinity. This correlation permits the conversion of electrical conductivity to salinity. Sanford’s team collected a time series of water-column electrical conductivity that they converted to salinity. The inferred salinity was shown to agree with the salinity readings from the CTD. (figure 2)
| Figure 1 | |
 |
The quasi-static electrical analog circuit for electric currents divided between the parallel resistors of saline water (Rw ) and the sediment (Rs ) is such that: Vr /Is = CRwRs /(Rw + Rs ) = C(Σw + Σs )-1 , ∴ Σw = CIs/Vr – Σs, where Σw is the conductance (vertical integral of σ) of the river, C is an empirical calibration value, Is is the source current, Vr is the receiver voltage and Σs is the conductance of the sediments.
|
| Figure 2 | |
 |
Observed vertically integrated salinity from CTD casts (red dots) compared to that inferred from the electrical measurements using the electrical conductance time series fitted to the equation: Sw = 8.82*(CIs/Vr -Σs ), where C is an empirical coefficient equal to 43, Is is source current and Vr is observed electric field and Σs an offset caused by leakage into the sediments equal to 8. Blue dots are observed electrical conductance and the continuous curve is the electrical conductance, both converted by salinity by the factor 8.82 psu/S/m.
|
CMOP researchers are looking at Sanford’s new sensor as an opportunity to better explain processes as diverse as internal waves, estuarine turbidity maxima, and summer blooms of Myrionecta Rubra. They expect to improve computer models that are designed to characterize the state and variability of the estuary, and anticipate changes associated with climate and human impact. Once demonstrated for the Columbia River, the new sensor has the potential to be used in estuaries across the world.


