You are here
QA per variable
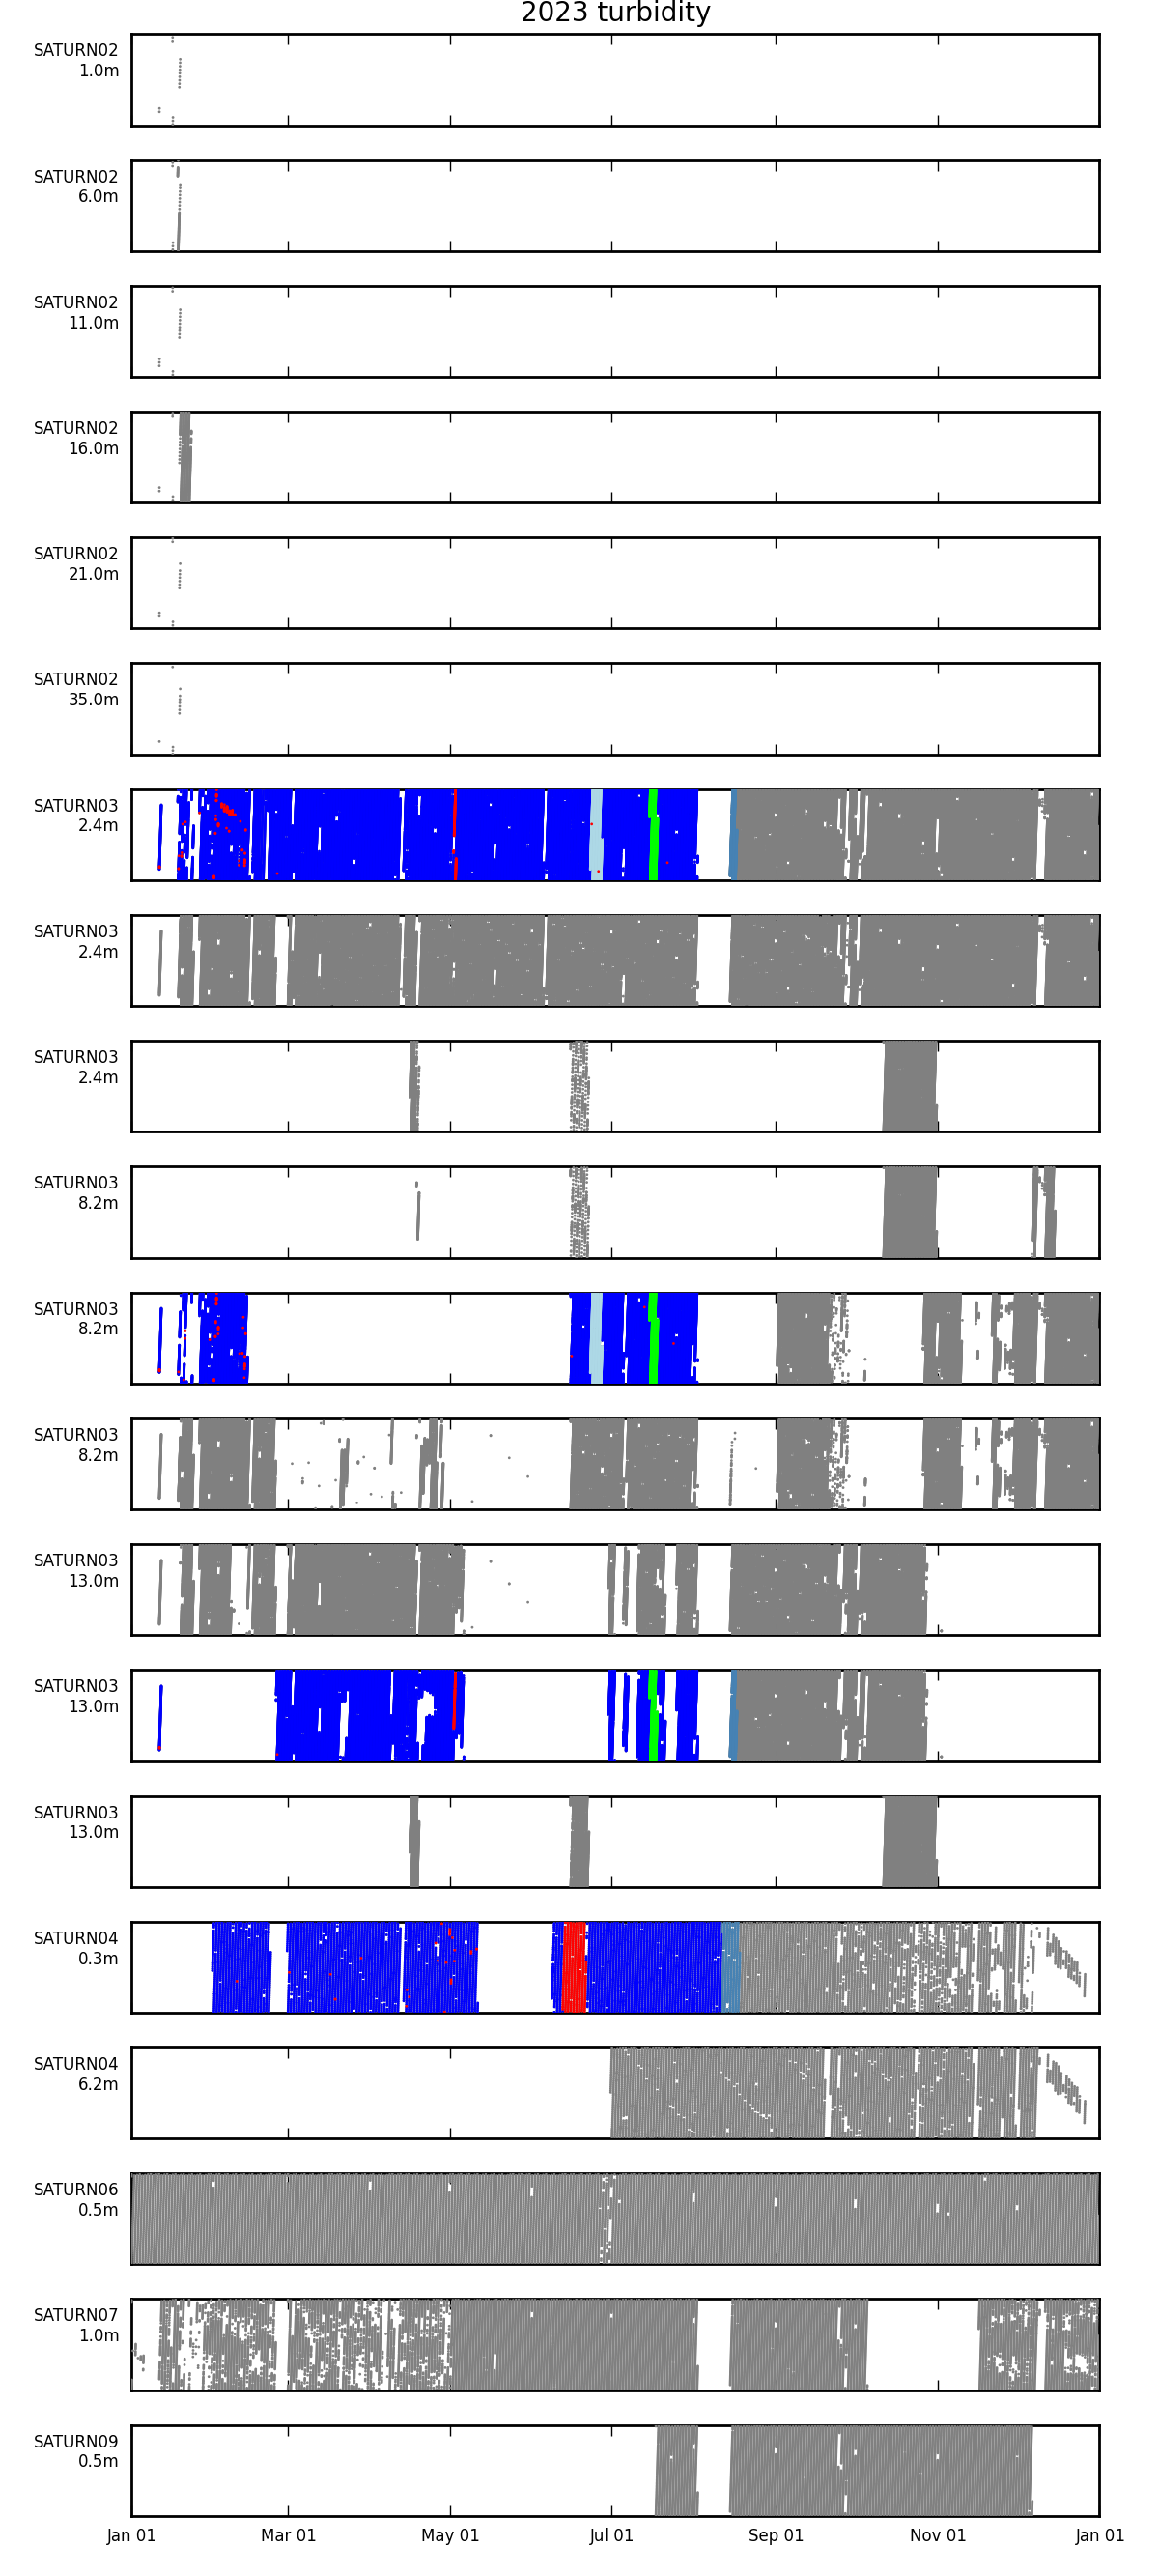
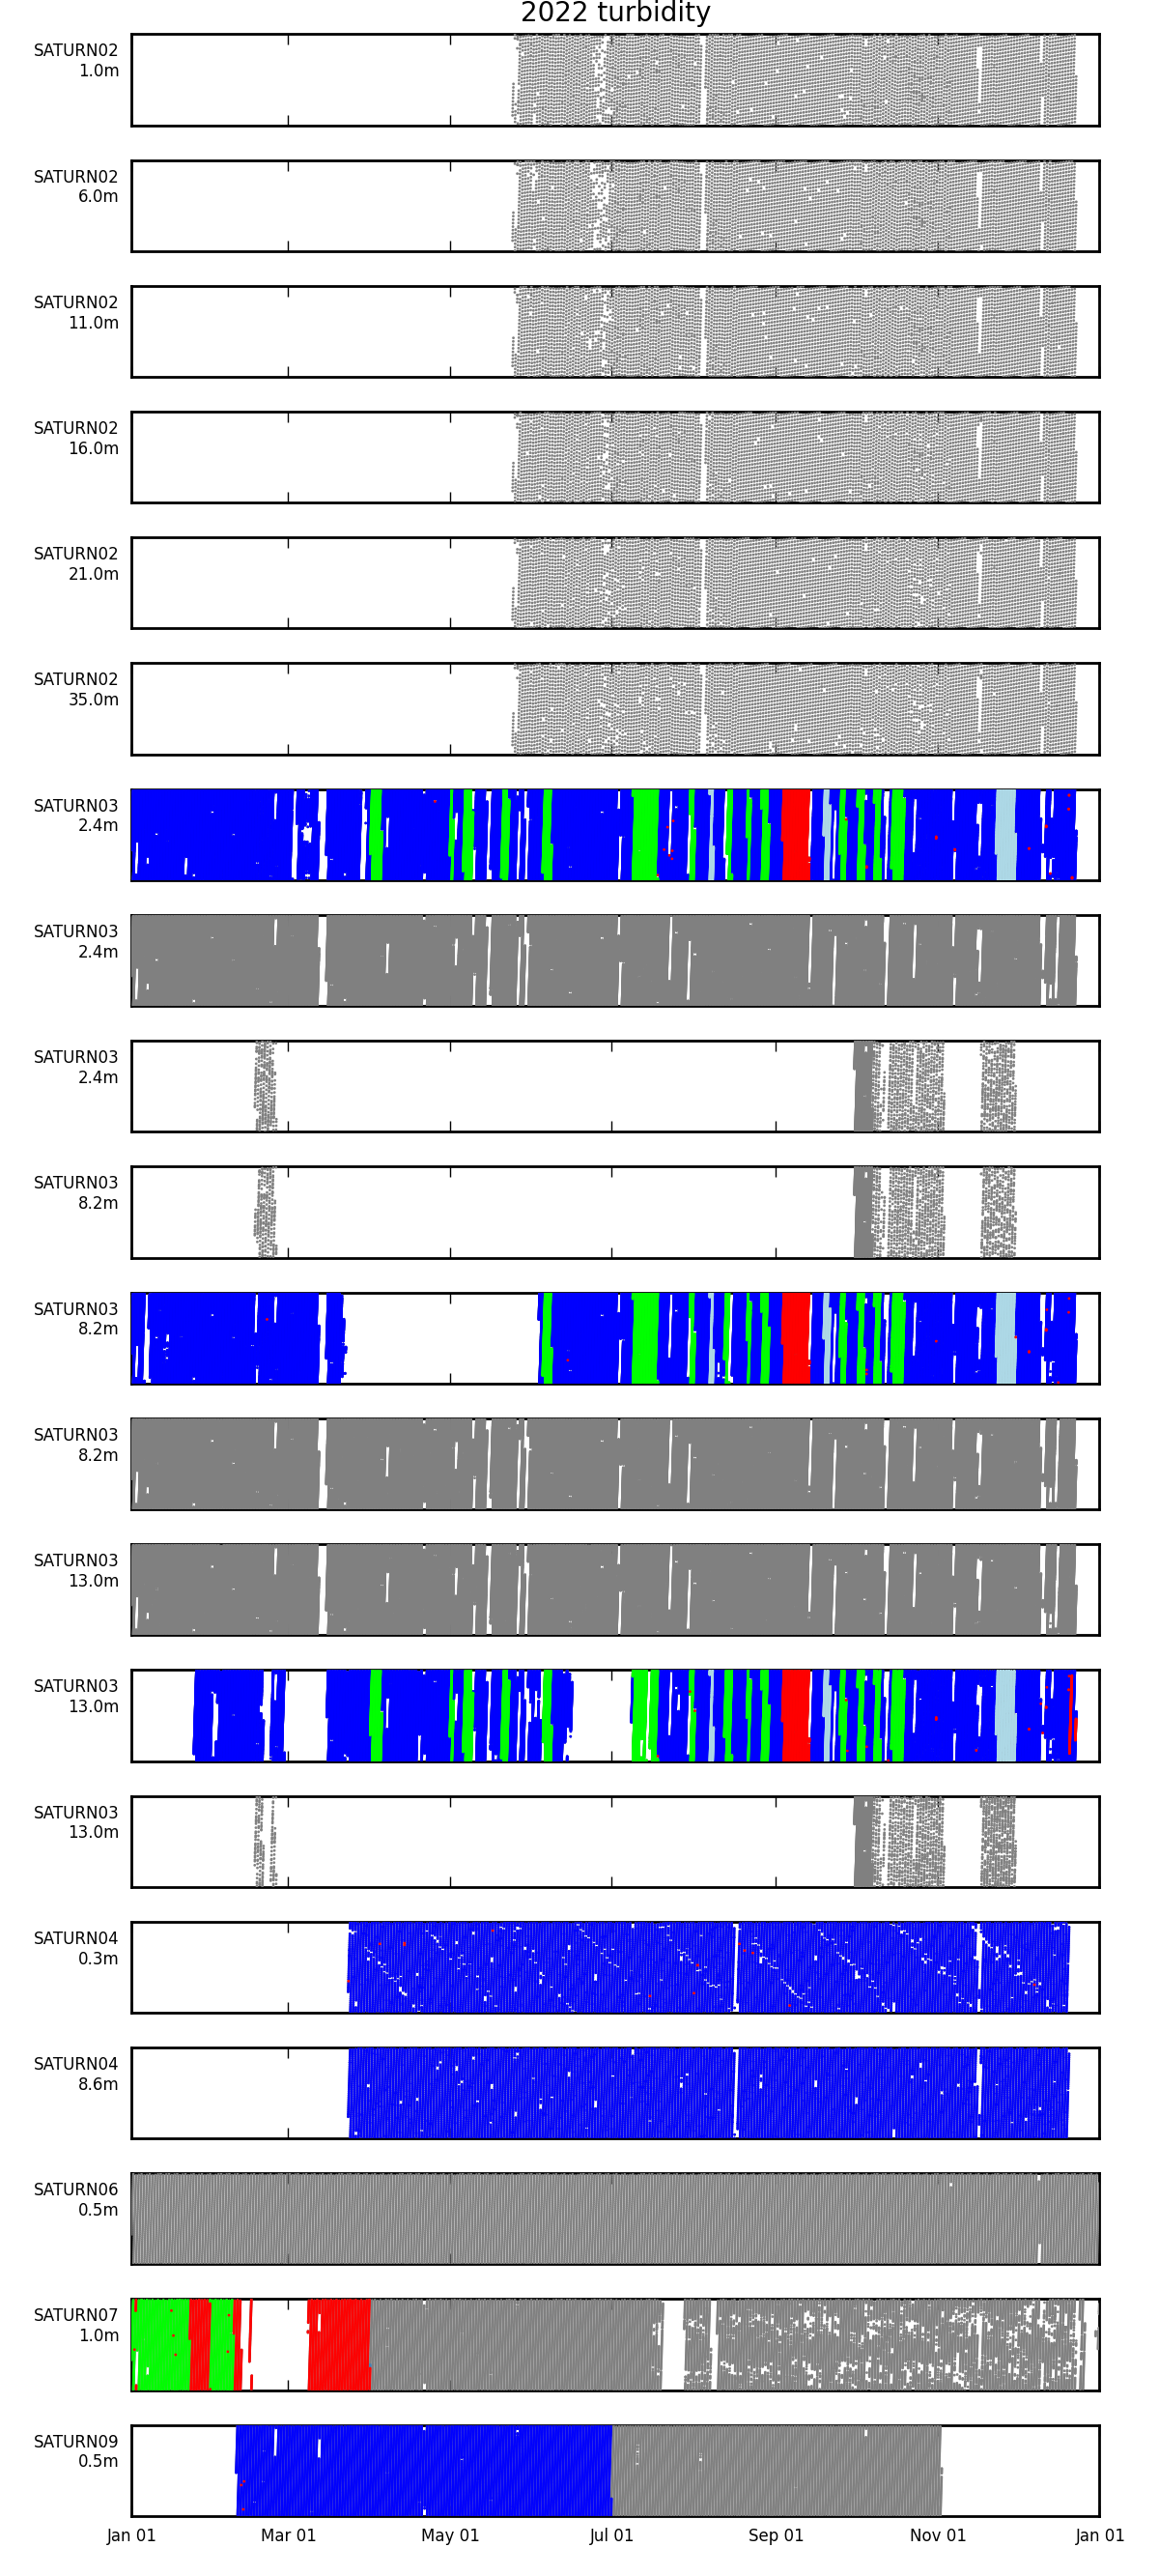
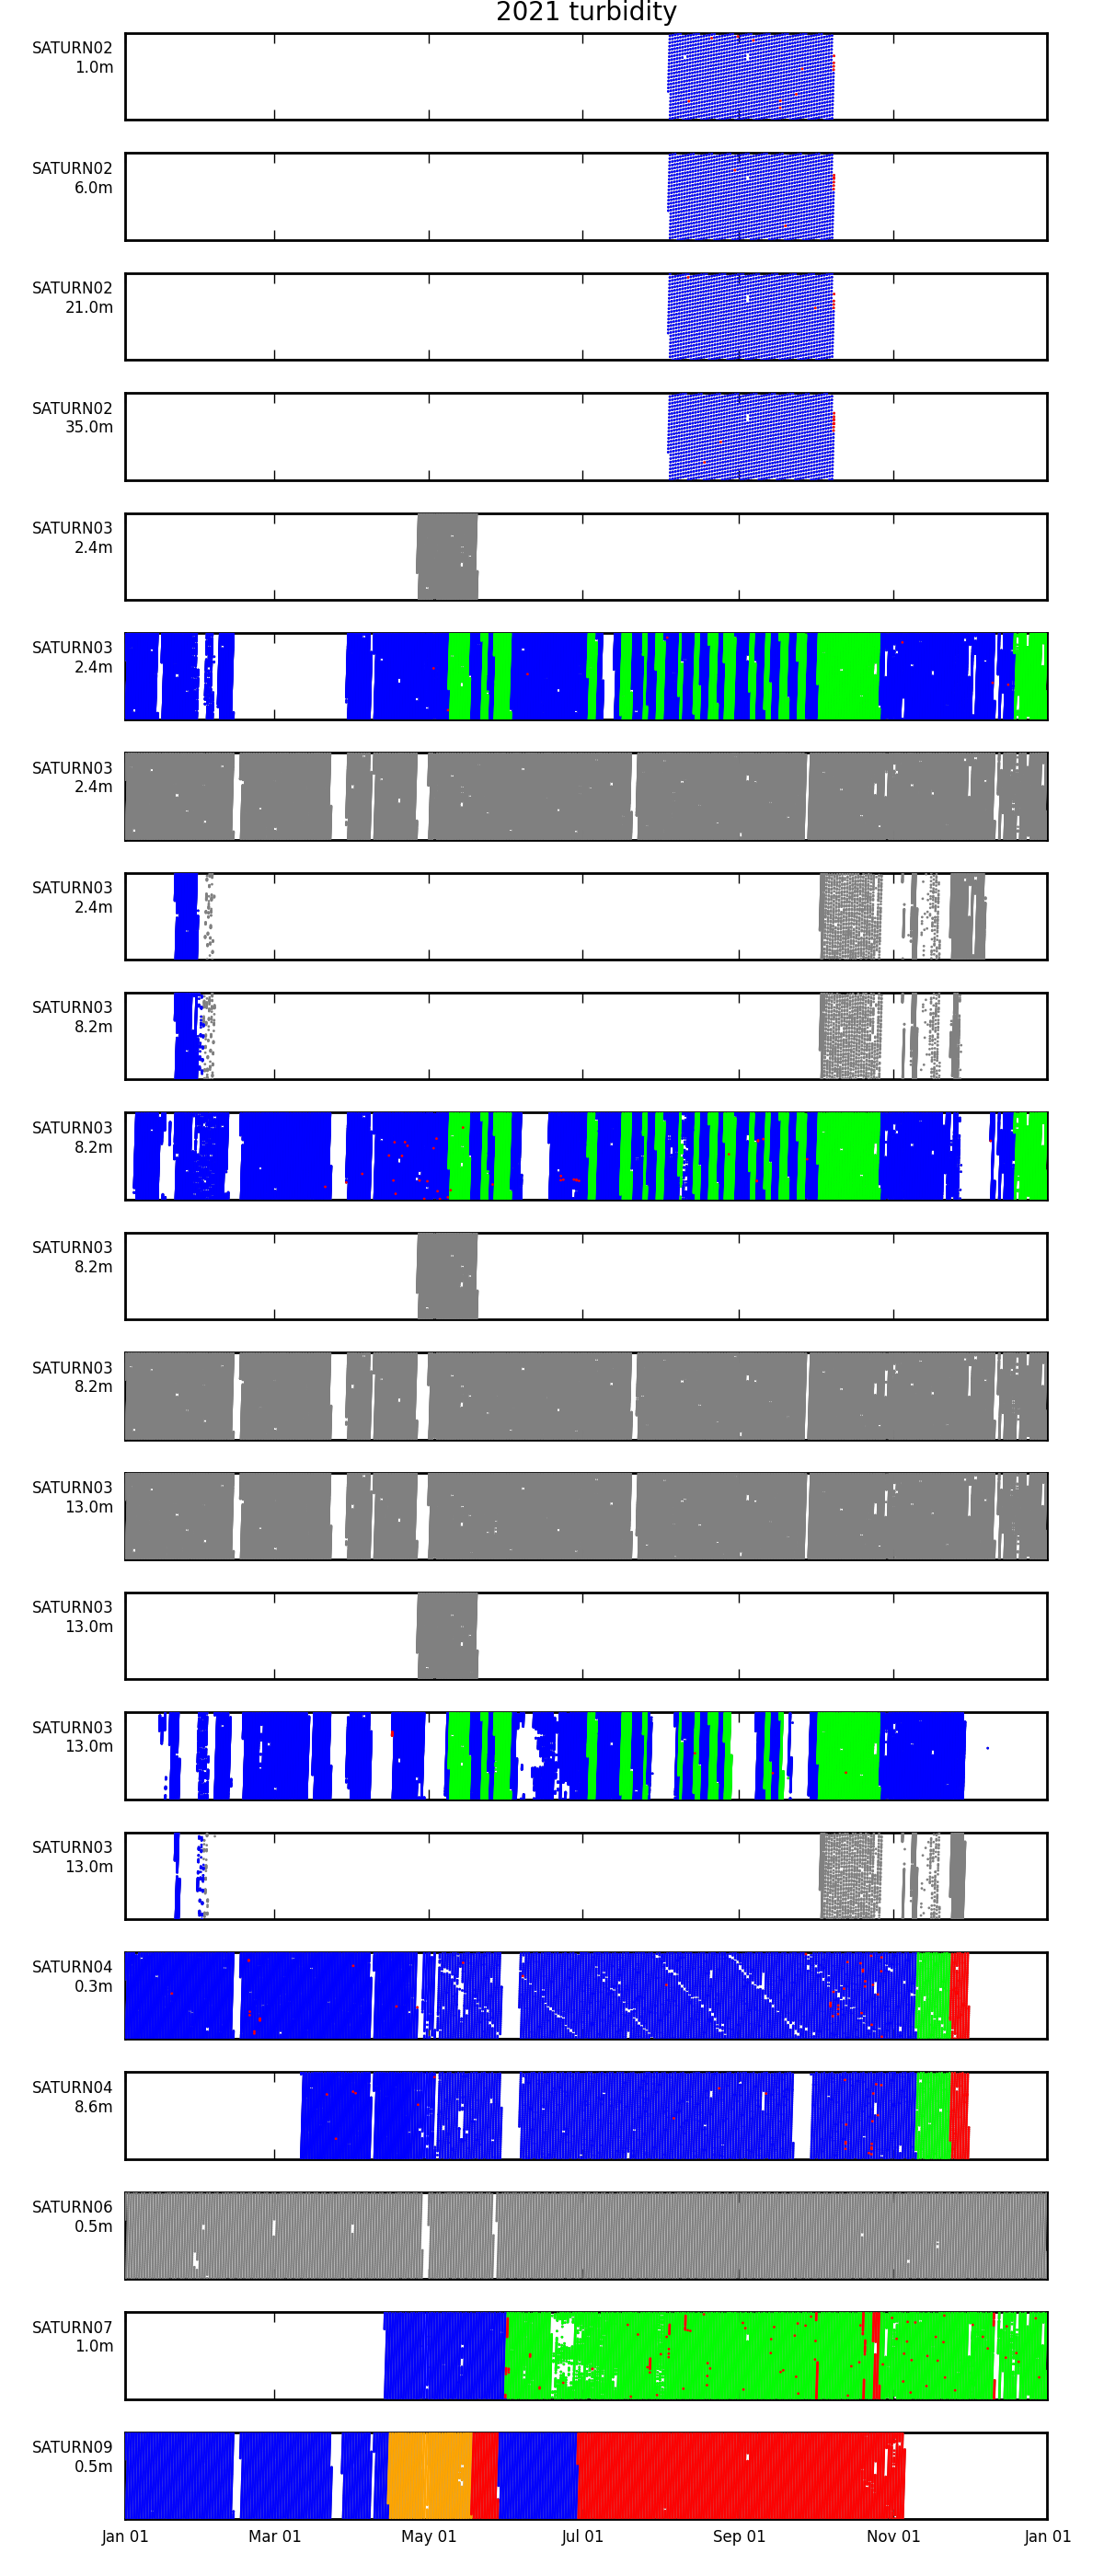
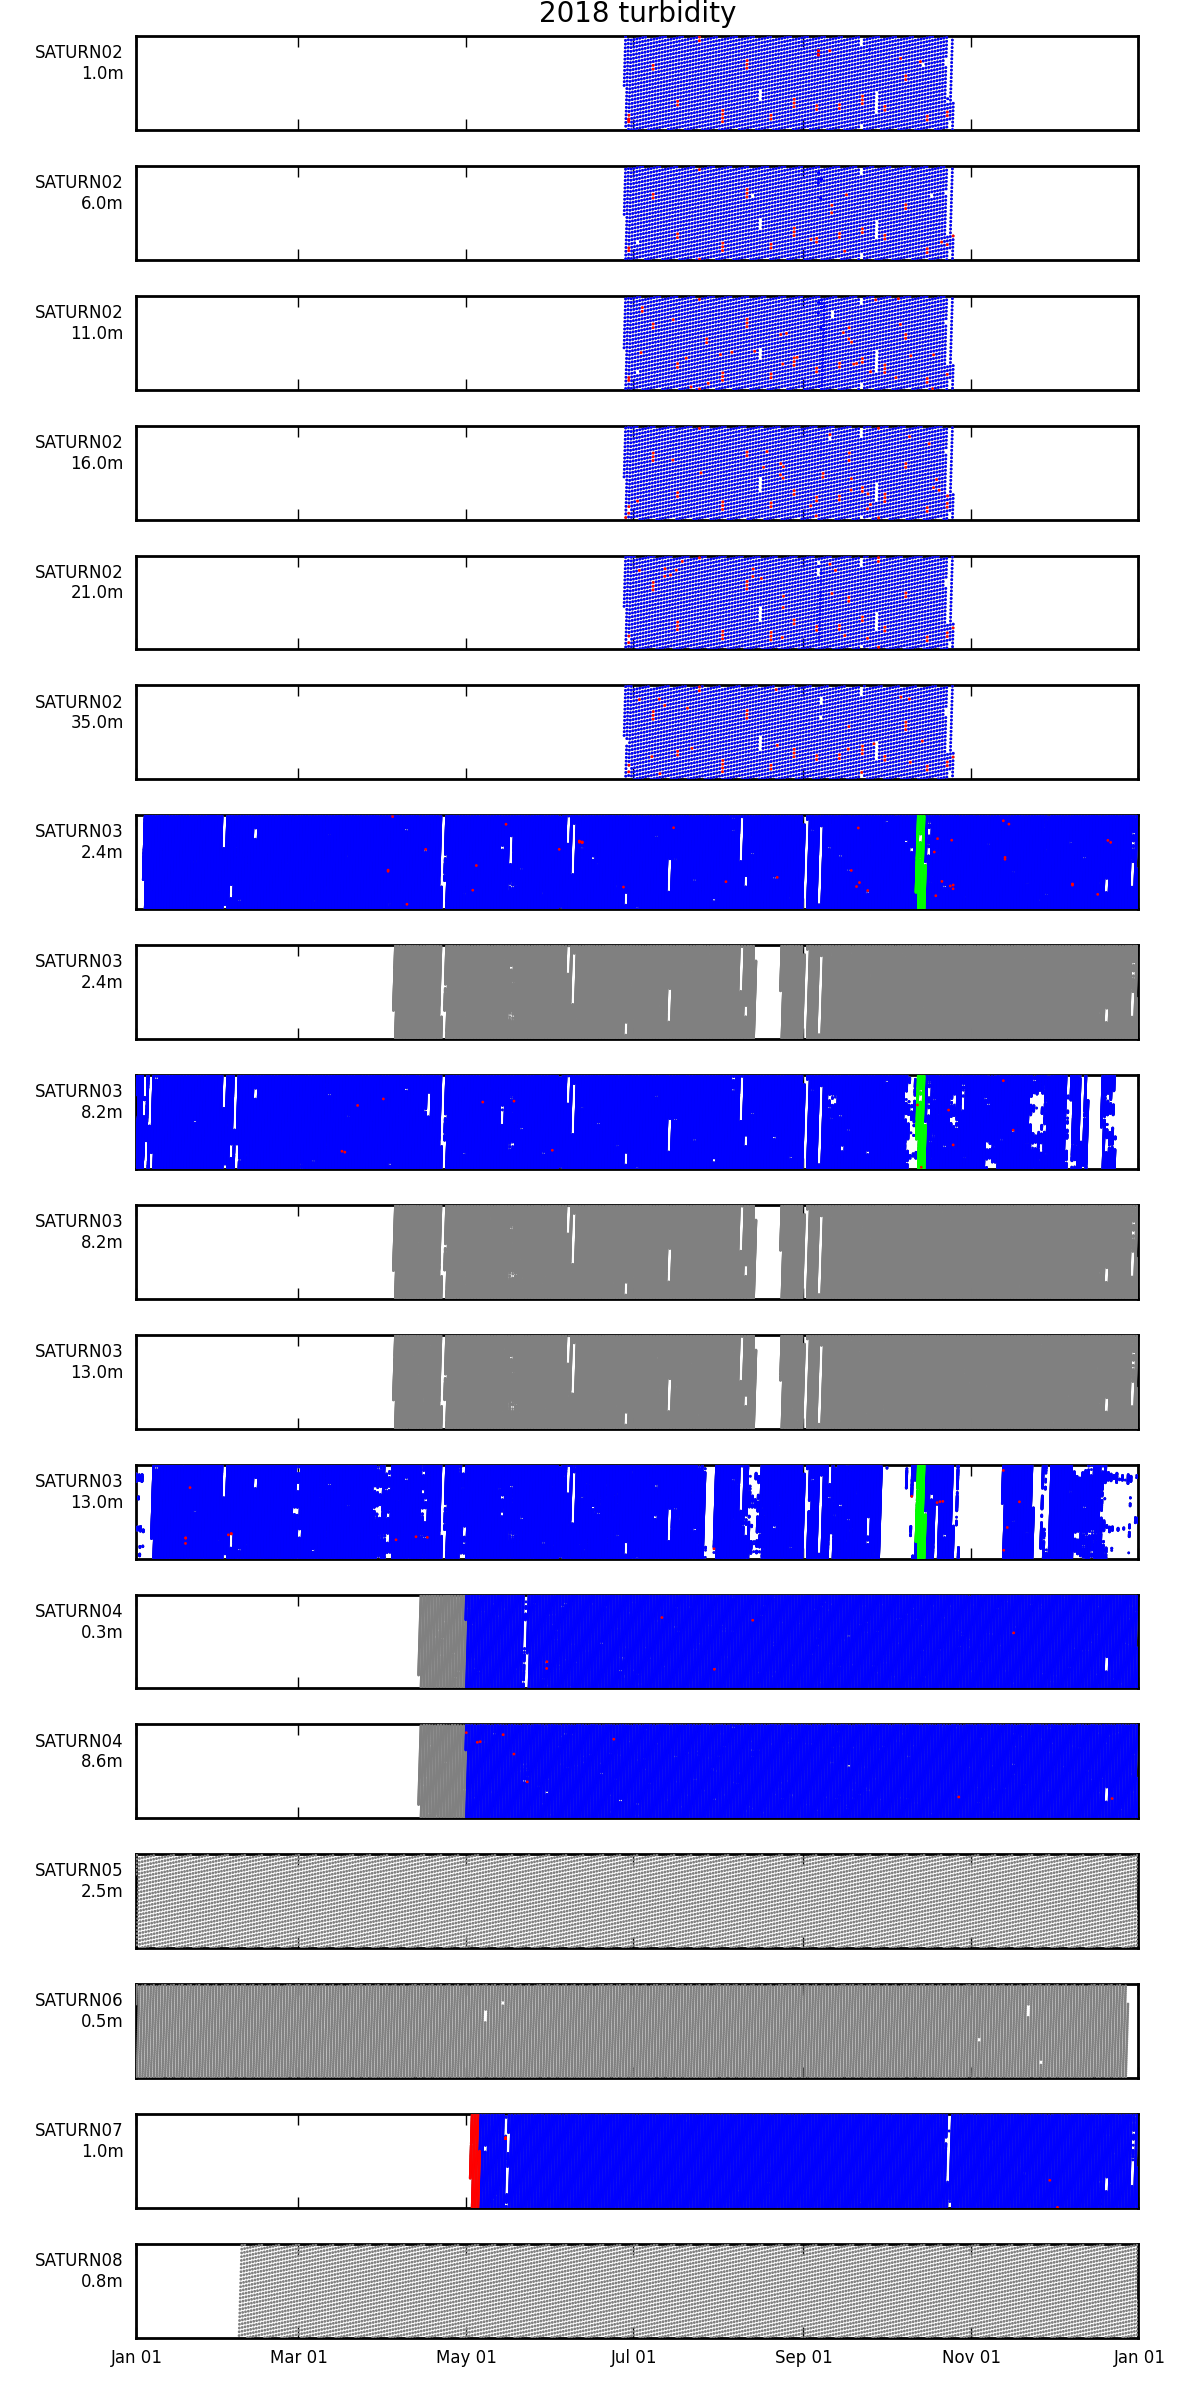
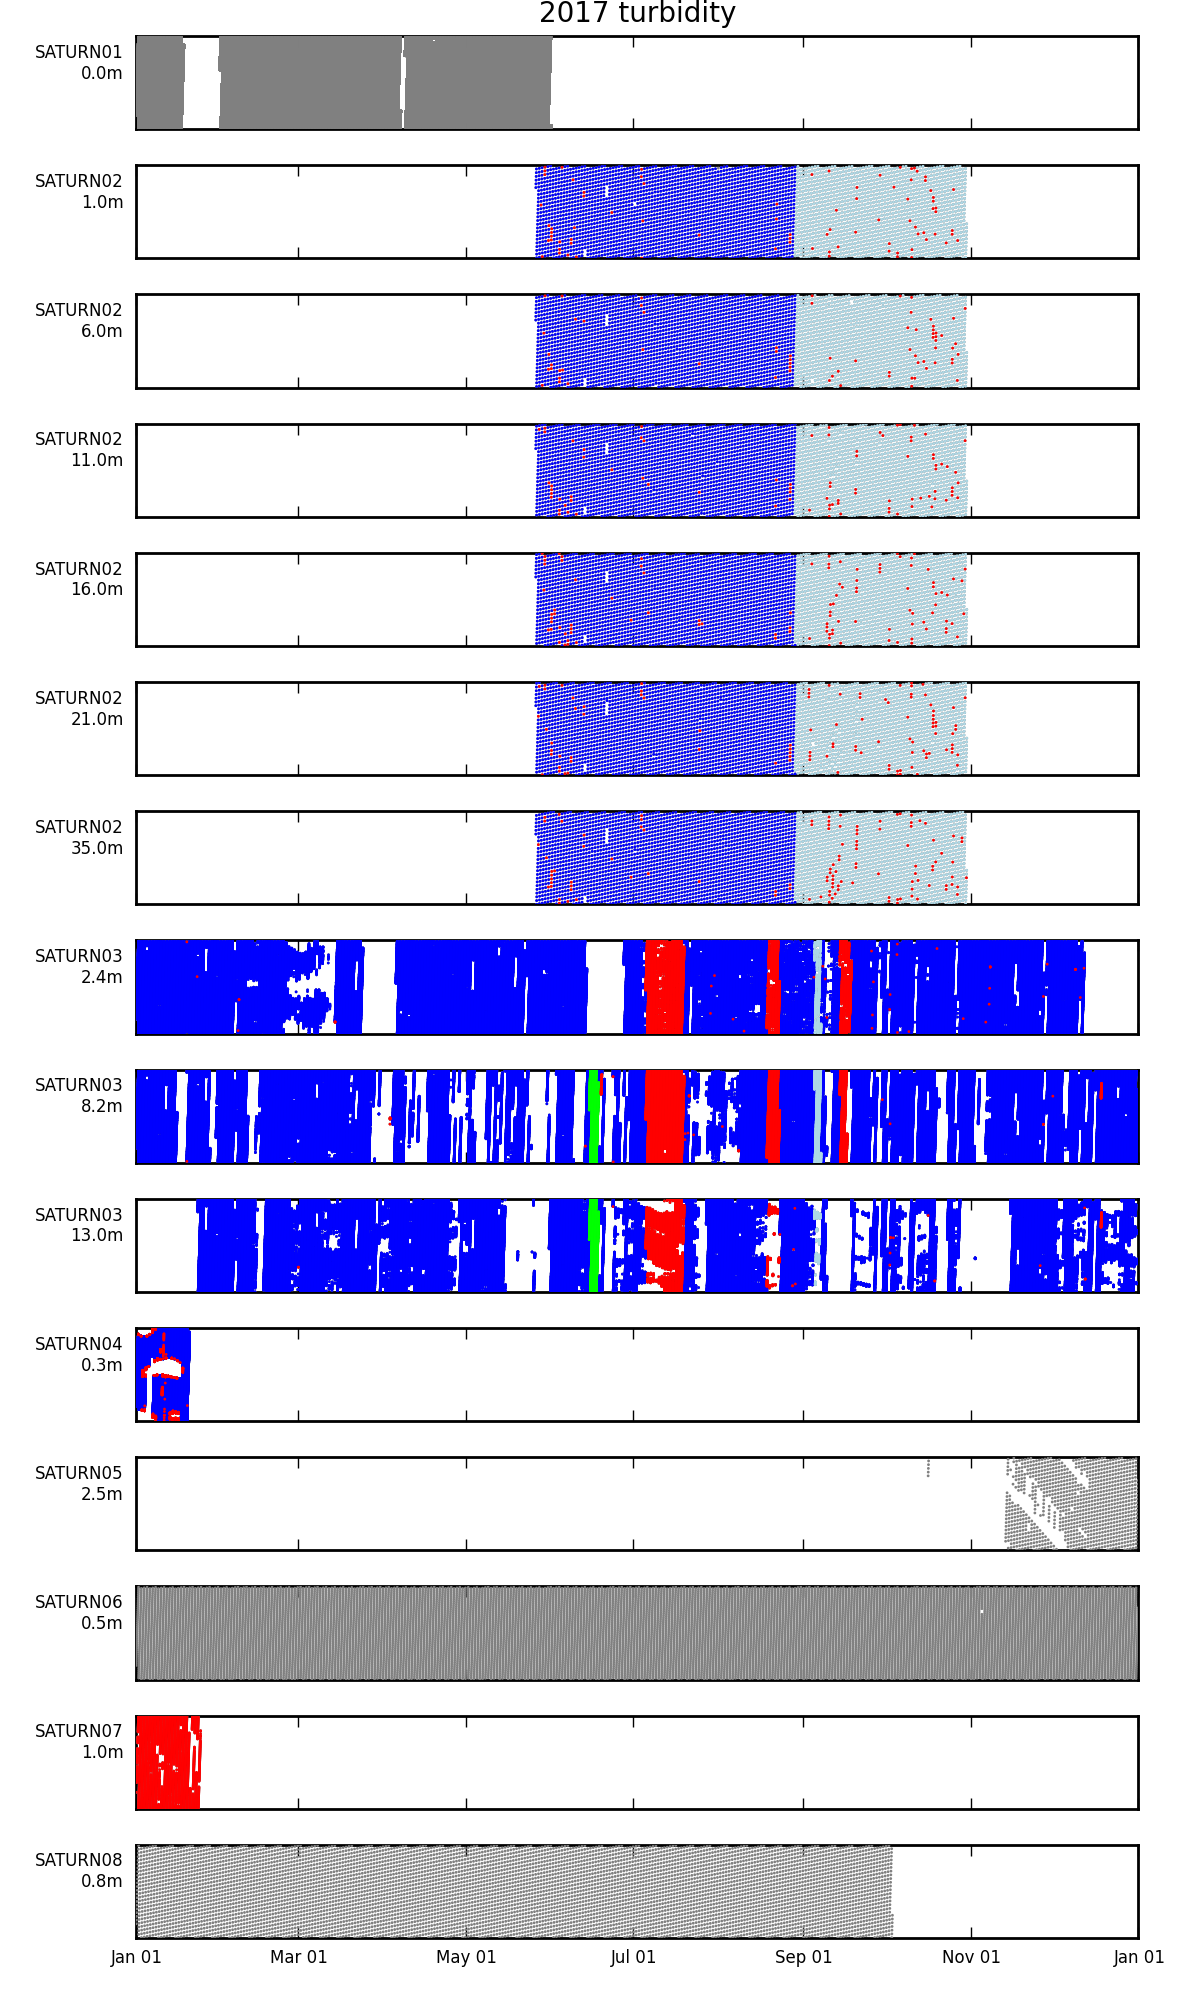
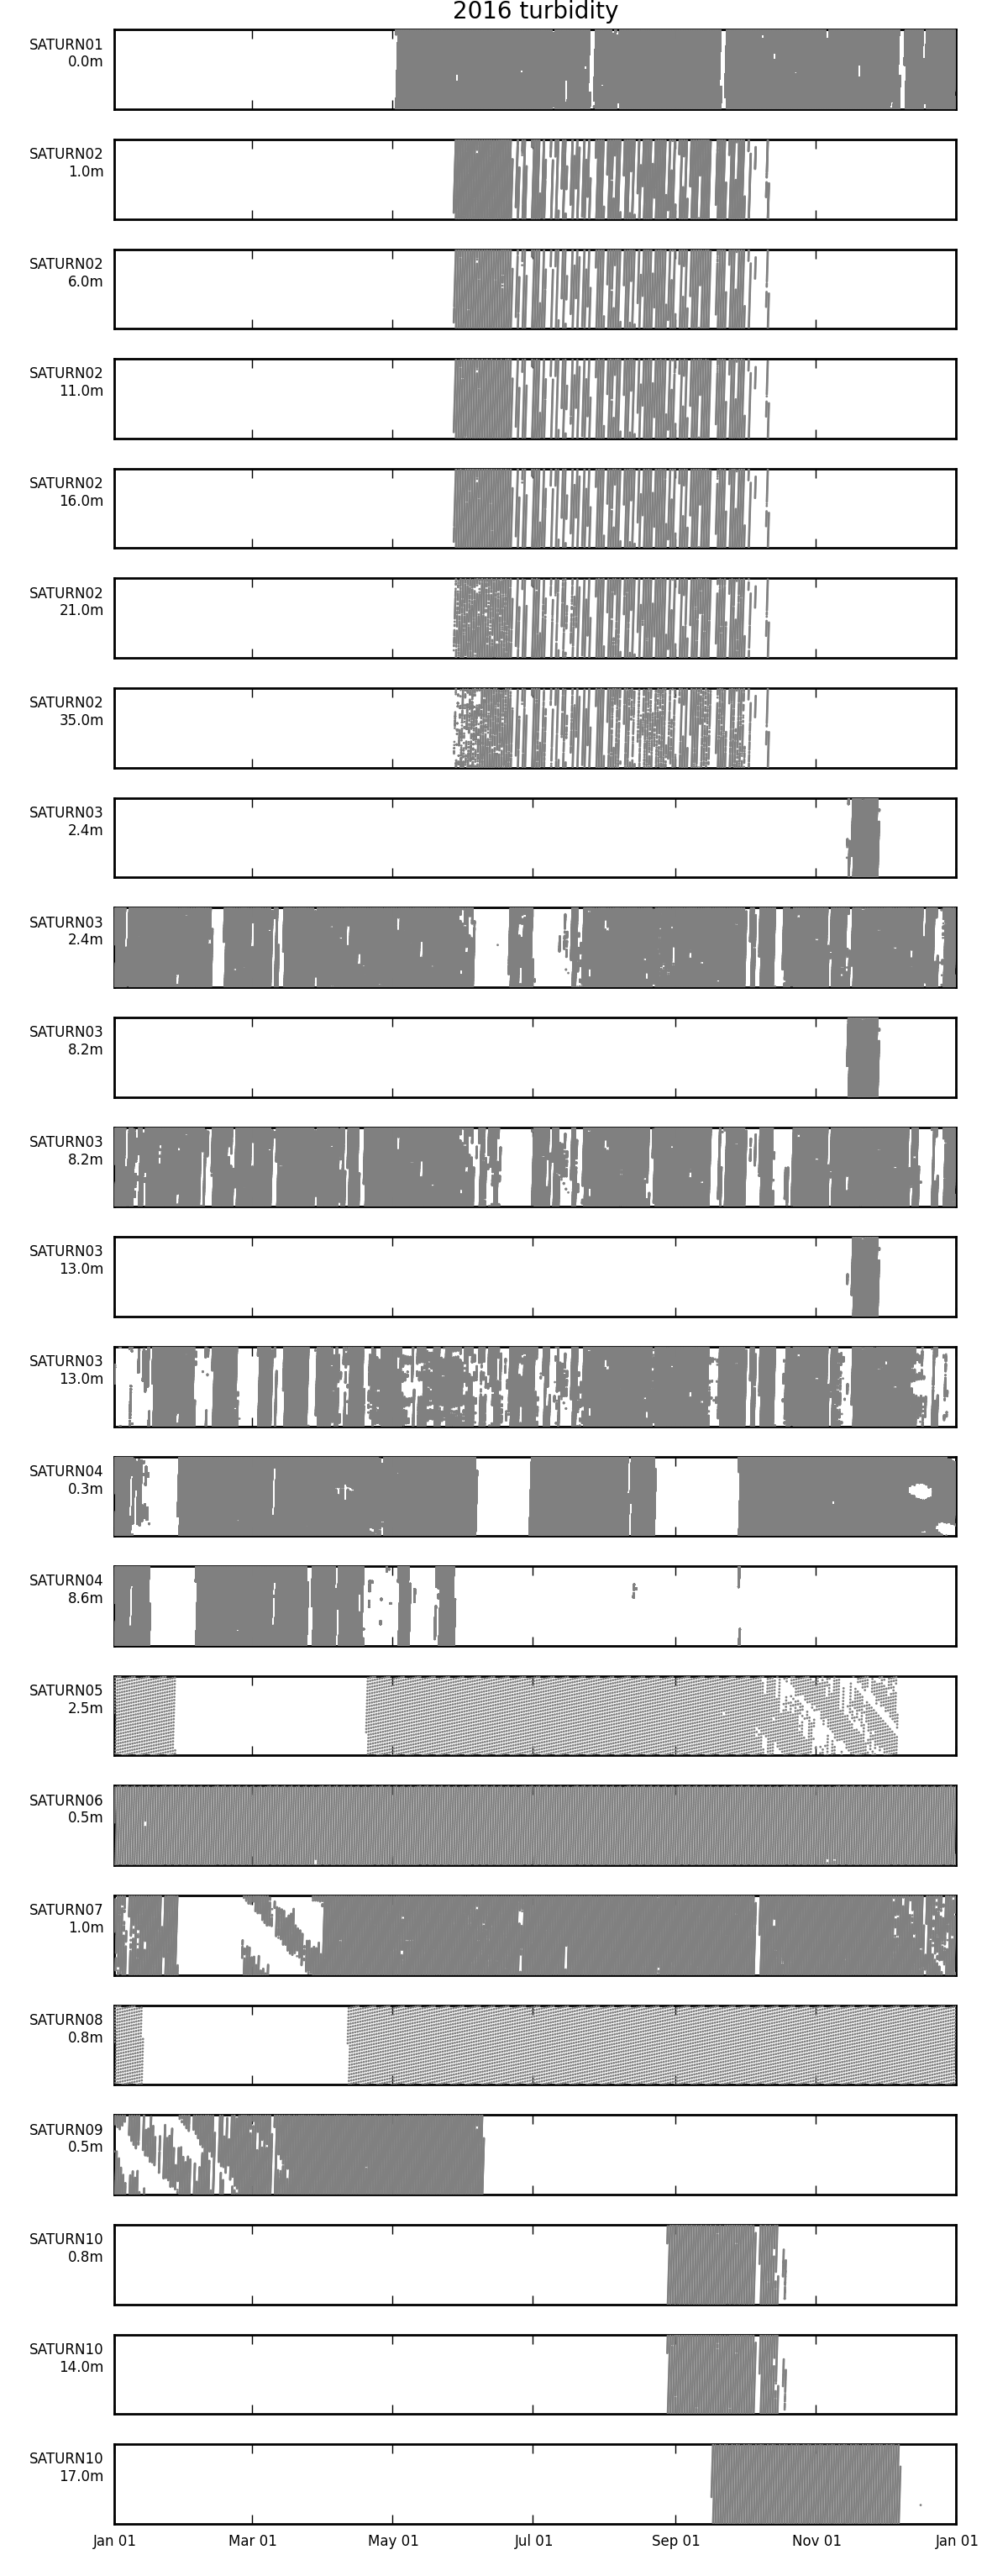
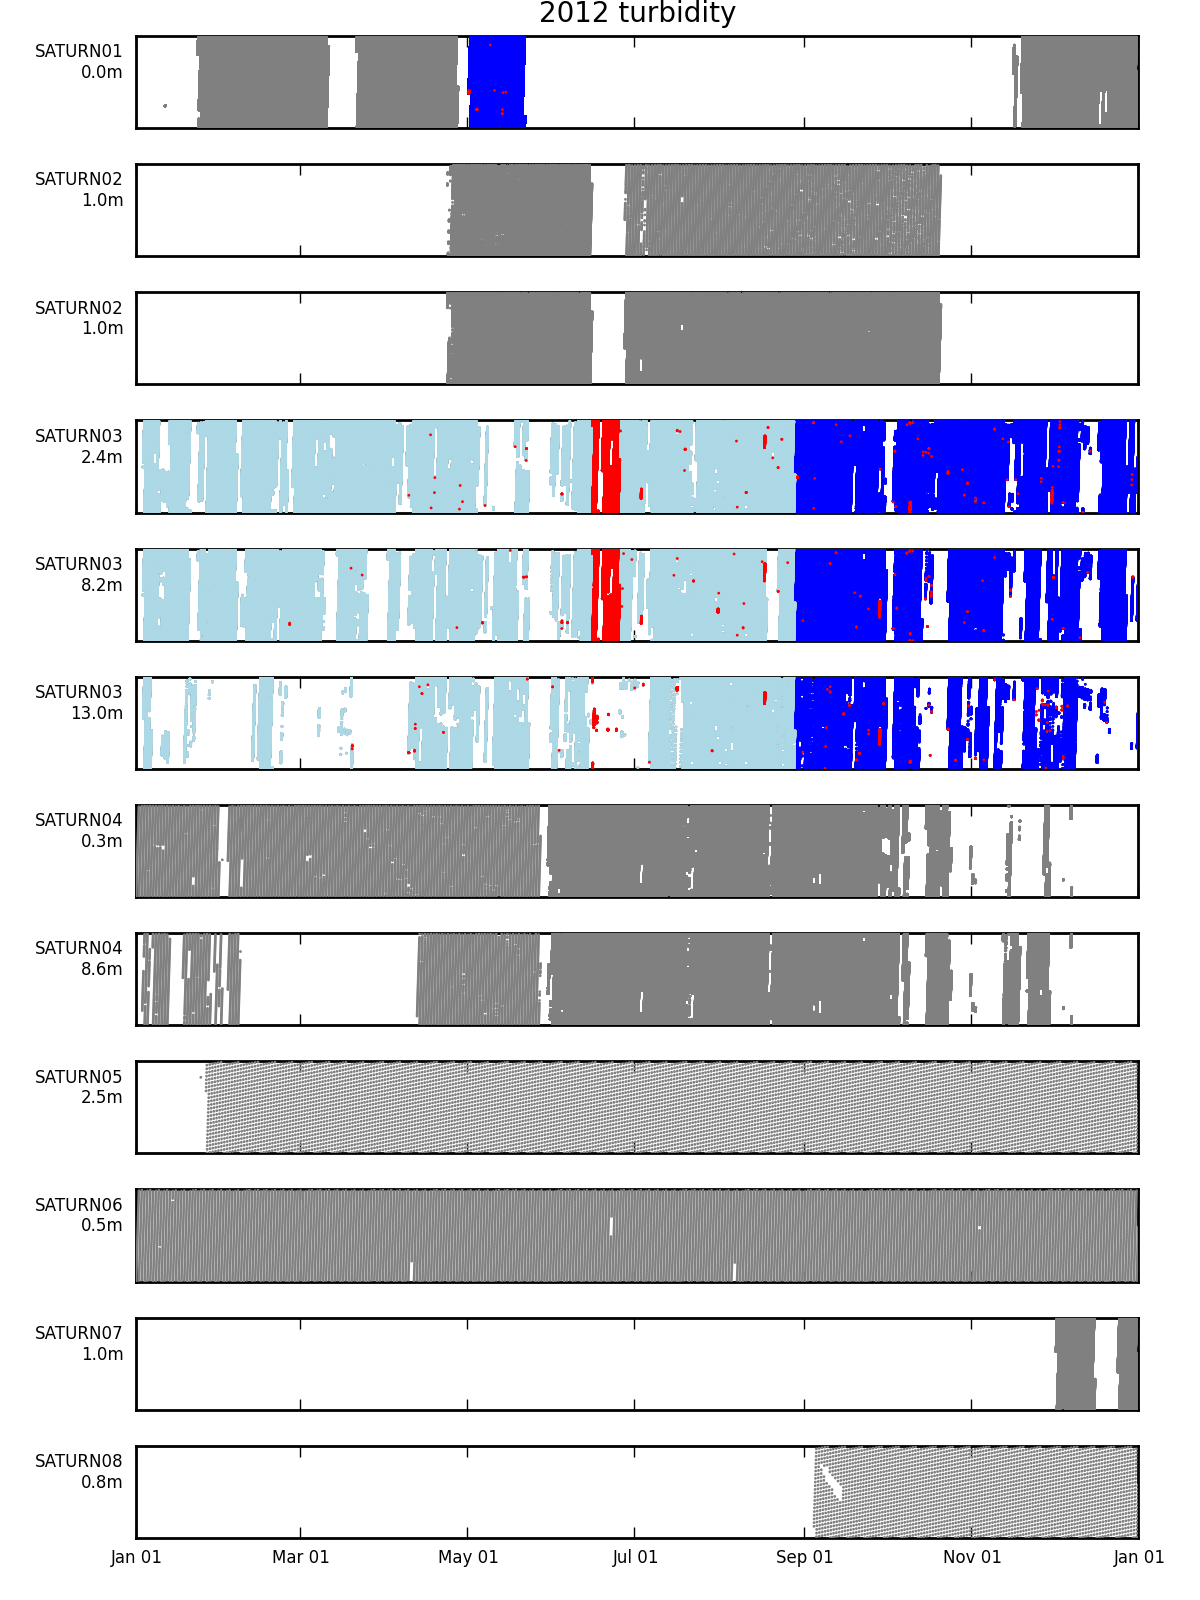
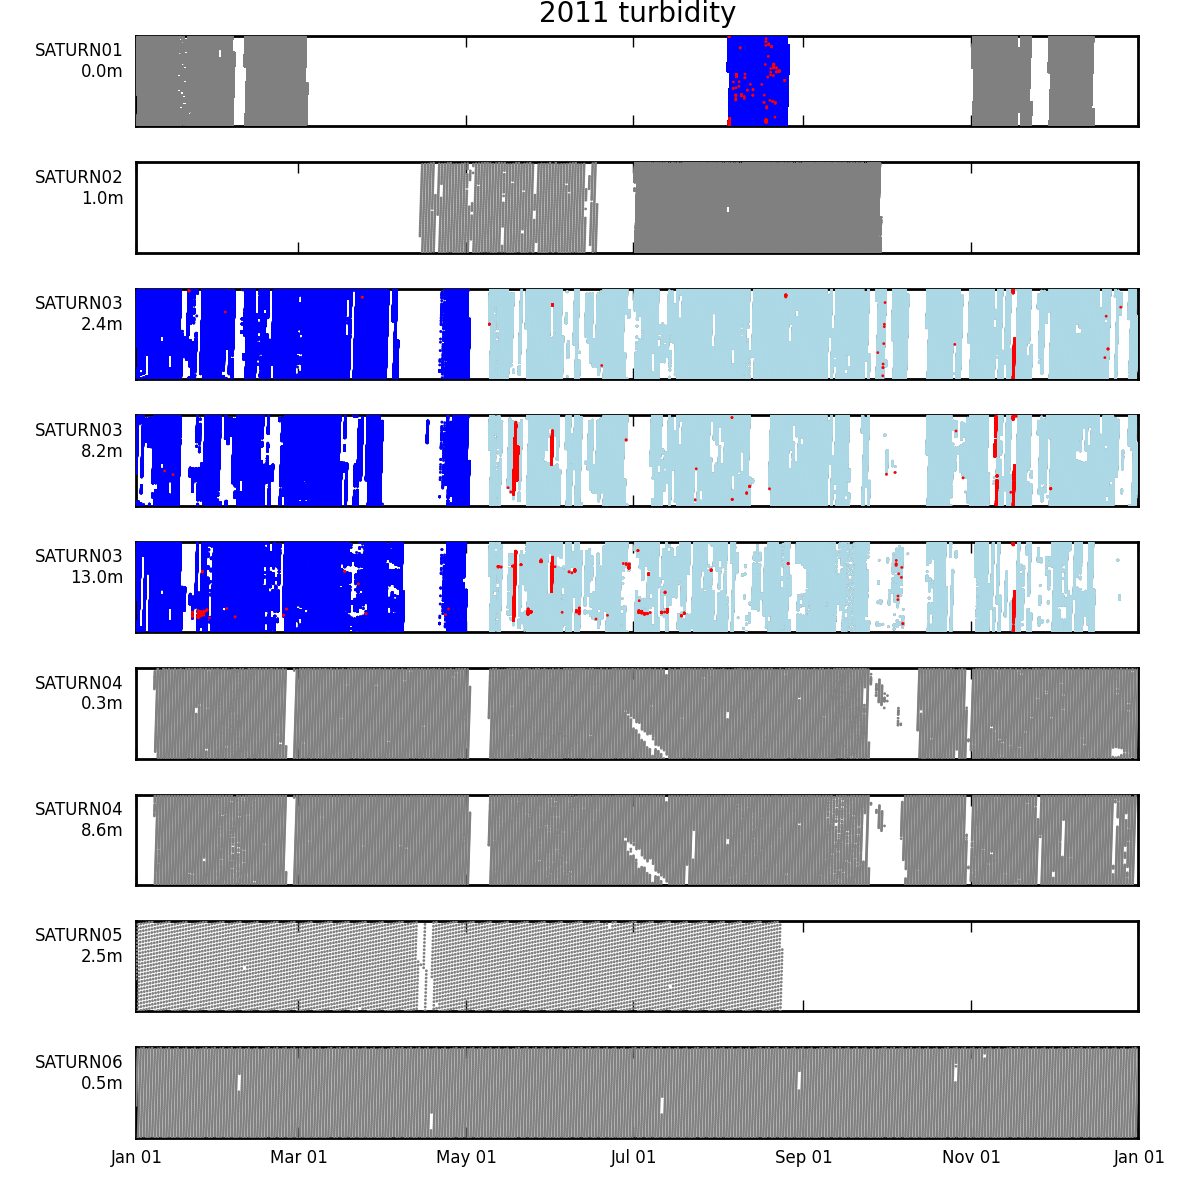
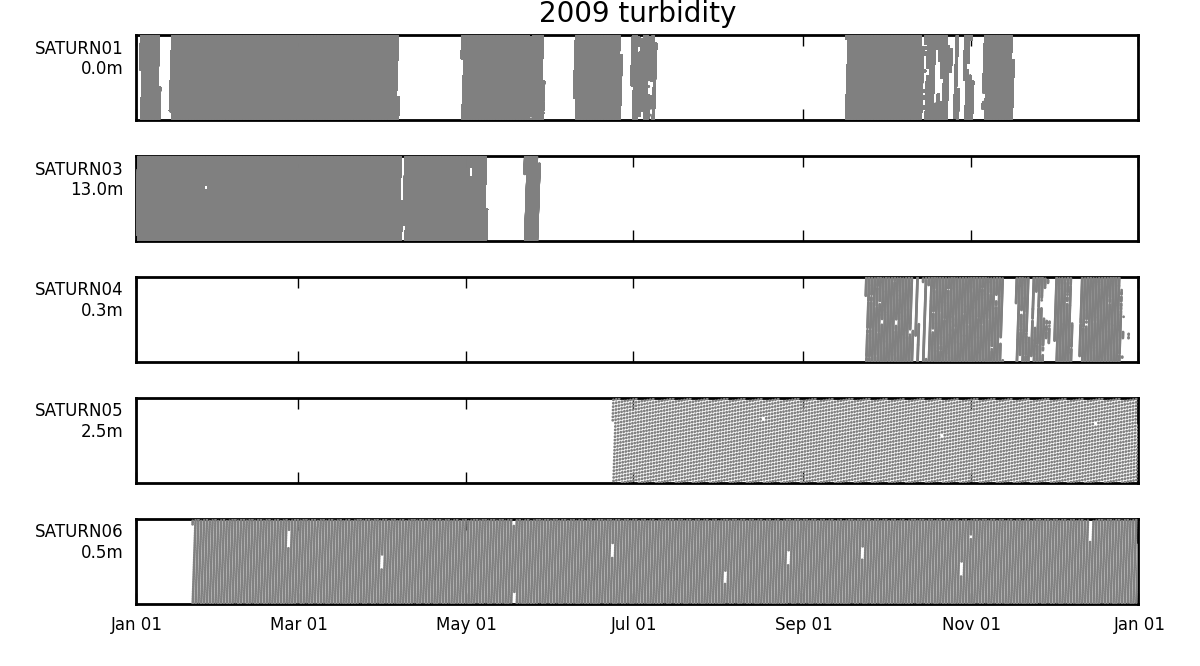
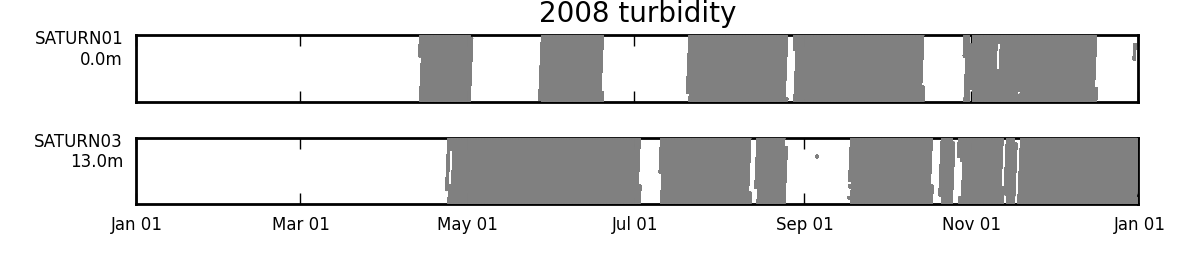
See the page QA/QC Information and Procedures for general information regarding quality controlled data levels and QA/QC procedures. The graphs below plot the variable of interest using time of the observation against the fraction of the tidal day for that time colored by the quality levels for the given variable. Colors map to quality levels using the following legend.
| Raw data | ||
| QL1: | is within current parameters for evaluating data as good (sensor specific) | |
| QL2: | is possibly within current parameters for evaluating data as good or is outside by a moderate degree | |
| QL3: | data quality issues/concerns or data corrected; see QA/QC information to determine if data are suitable | |
| QL4: | data have significant quality issues/concerns and should be used with caution | |
| QL5: | bad data; outliers |