Phytoflash
The Phytoflash: An in-situ submersible active fluorometer at the Endurance Station Saturn-03
What variables do the Phytoflash measure and why are they important in estuaries?
The Phytoflash is an in-situ sensor that measures active fluorescence of phytoplankton in mesotrophic and oligotrophic environments. Active fluorescence parameters include the in-situ chlorophyll a fluorescence, or minimum fluorescence (Fo), maximum fluorescence (Fm), variable fluorescence (Fv=Fm-Fo), and quantum efficiency, or yield (Fv/Fm). The quantum yield is a parameter that describes photosynthetic efficiency, or how well phytoplankton can assimilate light. This biological indicator responds quickly to changes in environmental forcings, nutrient stresses, and anthropogenic inputs such as toxins and ballast waters. It can thus be a useful tool for measuring phytoplankton health, nutrient availability, harmful algal blooms, and an overall sign of system change.
What are the measuring principles of the Phytoflash?
As stated before, the Phytoflash measures the photosynthetic efficiency of phytoplankton. Specifically, it measures active fluorescence to estimate the photochemical efficiency of Photosystem II (PSII). PSII is a protein complex found in all oxygenic photosynthesizers that harvests light energy to split H2O into O2. PSII contains many reaction centers that are open during photosynthesis when a free flow of electrons is transferred through PSII. Photons of light are absorbed by the chlorophyll a molecule (P680) and electrons are raised from the ground state to an excited state. P680 then transfers the electrons to plastoquinone (Qa) which acts as an electron acceptor. At this point most of the electrons are being passed to Qa for photochemical conversion and the likelihood of fluorescence is low, so the minimum fluorescence (Fo) is taken.
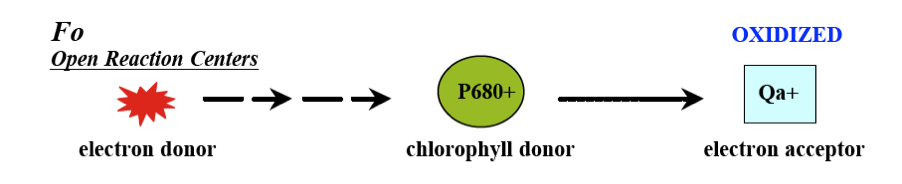
Maximum fluorescence is then the maximal likelihood that electrons will be given off as fluorescence. In order to do this, a flash of saturating light is sent into the sample cell. The reaction centers, which were oxidized and open during the minimum fluorescence reading, will close and become completely reduced. At this point Qa cannot process the excitations fast enough and maximum fluorescence will occur. The resulting difference between Fo and Fm (Fv) then signifies the portion of absorbed light energy used in photosynthesis when all reaction centers are open. The ratio of Fv/Fm is then the quantum efficiency or yield of this primary photochemical reaction of photosynthesis.
How does the Phytoflash work at Saturn-03?
The Phytoflash has nine light emitting diodes (LEDs) that emit at a 465 nm wavelength peak with an excitation filter at 500 nm and an emission filter at 680 nm. To determine Fo three low intensity monitoring LED’s are activated. These low intensity LEDs do not increase the photosynthetic rate. To determine Fm, the remaining six high intensity LED’s are activated, saturated the sample cell with light.

The Phytoflash is deployed at Saturn-03. This station has a pumped flow-through system, currently collecting data from two water levels: 2.4m and 13m below MSL. Instruments on Saturn-03 are installed in a dock with shore power and land access.

Any operational considerations?
The Phytoflash can operate in a wide range of temperatures(-2 to 50 degrees C) and up to 600 m depth. It has three operating modes, including a Self Contained Mode, where the internal data logger can accumulate up to 10,000 points and a large range of logging times and intervals (5 seconds to 600 minutes). The other two operation modes are an Integration Mode with a CTD and a Laboratory Mode. Fluorescence is also temperature sensitive. As the temperature increases, fluorescence decreases. Other factors such as turbidity, pH, and quenching can also affect fluorescence if not corrected for properly. The Phytoflash manual contains calibration instructions and functional tests can be performed to ensure the system is working properly. For more information about the Phytoflash visit http://www.turnerdesigns.com/t2/instruments/phytoflash.html
How do Phytoflash parameters change during a spring-neap tidal cycle?
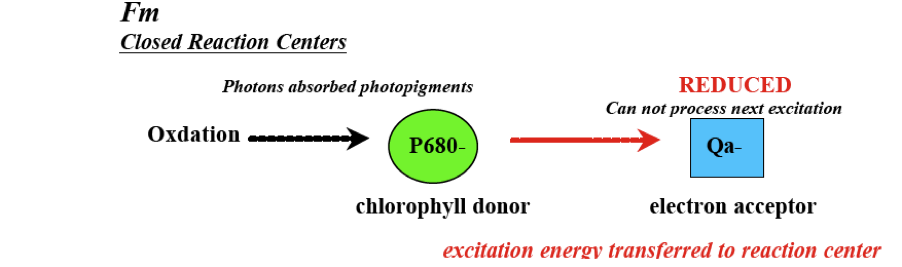
To answer this question and the following questions, data from the Saturn-03 observatory was obtained at 2.4m and 13m during the period of 9/25-10/30. The data used from Saturn-03 includes Phytoflash outputs (quantum yield, Fo), LISST-100 sediment concentration, salinity, and temperature. Other data includes tidal elevations from Hammond tide gage and river discharge from Bonneville Dam. Saturn-03 is located near the mouth of the Columbia River and is greatly impacted by tidal forcings. Over this time period, two neap-spring transitions occur (~9/25-10/4 & 10/10-10/17) and two spring-neap transitions occur (~10/4-10/10 &10/17-10/25). Salinity responds accordingly at both depths, with a smaller range of salinities occurring during neap tides than spring tides at both 2.4m and 13m. Likewise, there are lower salinities at 2.4m during neap tides as less vertical mixing is occurring and the water column is more stratified with less salt reaching the surface.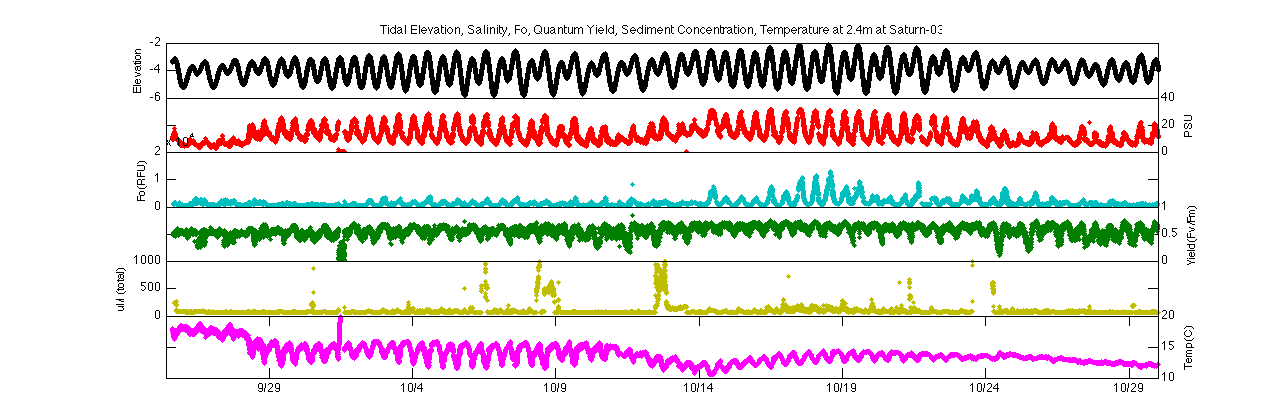
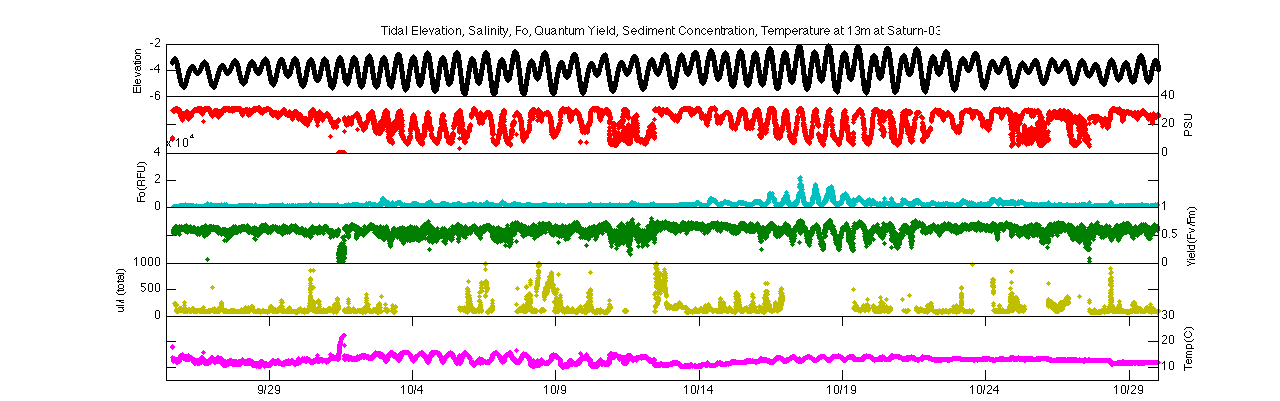
Elevation, salinity, Fo, quantum yield, turbidity, &
temperature at Saturn-03 at 2.4m (top) and 13m (bottom)
Minimum fluorescence and quantum yield also follow this trend of greater variability during spring tides than neap tides. During neap tides, quantum yield values stay consistently within a range of 0.5-0.65, which is the range for healthy diatoms, the dominant class of phytoplankton in the Columbia River. Minimum fluorescence, which is in-situ chlorophyll a fluorescence and can be used as a proxy for phytoplankton biomass, also stays relatively low and stable during neap tides. Typically during the spring-neap transitions, however, much more variation is seen and the quantum yield values dip below this 0.5 value. Likewise, minimum fluorescence becomes much more variable during spring-neap transitions.
Focusing on the second spring-neap transition (10/17-10/25) further demonstrates this trend. Both the minimum fluorescence and quantum yield follow a diurnal tidal pattern during spring tides but become much more constant during neap tides. During spring tides, minimum fluorescence and quantum yield increase during flood tide and decrease during ebb tide. This could signify that higher biomass concentrations of ‘healthier’ phytoplankton are moving in during the flood and low concentrations of stressed phytoplankton are moving out during the ebb.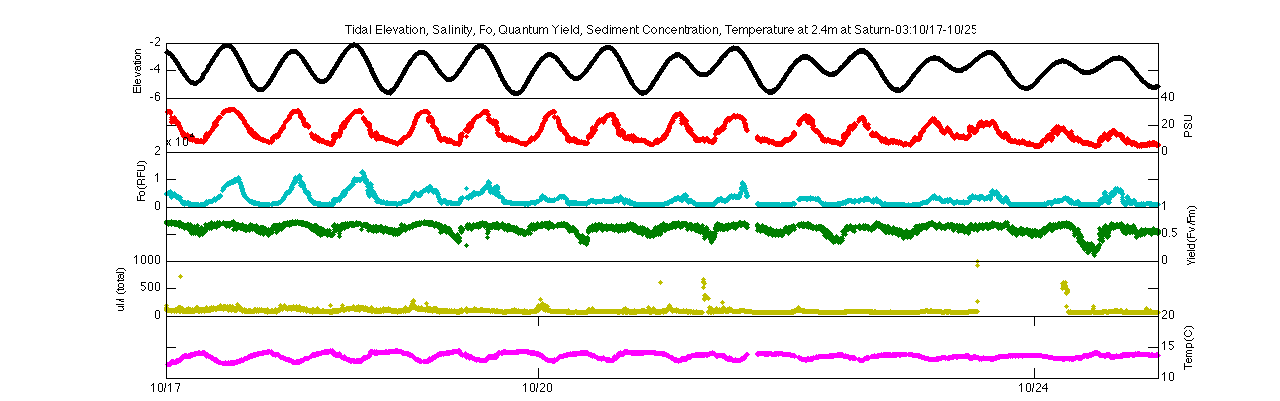

Elevation, salinity, Fo, quantum yield, turbidity, & temperature
at Saturn-03 for 2.4m (top) and 13m (bottom) during spring-neap
transition on 10/17-10/25
Spring-neap and diurnal tidal cycling also affect temperature, which is often considered a secondary stressor of phytoplankton. At both depths during spring tides there are greater variation between temperatures in flood or ebb tides, with higher temperatures in ebb tide representing warmer river water and lower temperatures in flood signifying the cooler ocean water. As the data period progresses, there is an decreasing trend in temperature at 2.4m, singaling the cooling of the river in late fall.
How is quantum yield affected by an ETM?
To study the affect an ETM has on quantum yield, a single ETM was chosen on 10/16, during spring tide. The ETM occurred during the middle of flood tide and was primarily seen at the 13m depth but did not penetrate up to the surface of the water column. The quantum yield at the surface behaves similarly to what was described in the previous section, increasing during the flood of spring tides and decreasing during ebb. At 13m this trend is prevalent before the ETM occurs, as quantum yield reaches its peak shortly after high tide. However, there is a brief period of time at the beginning of the ETM (6:36) where the quantum yield decreases during the flood tide instead of increasing. This brief depression persists until about 8:00, where after the quantum yield begins to increase again. While this is a very small change that just barely drops below a quantum yield of 0.5, it could be a sign of light limitation resulting from the increased turbidity. As turbidity increases, less and less light is able to penetrate deep into the water column as it is scattered and absorbed by particles. This decrease in yield could then be a sign of less light reaching the phytoplankton. It could also be a direct result of suspended particles absorbing light, which would decrease fluorescence. Whatever the case, it does not appear to be impacting the yield of the phytoplankton in a serious manner.
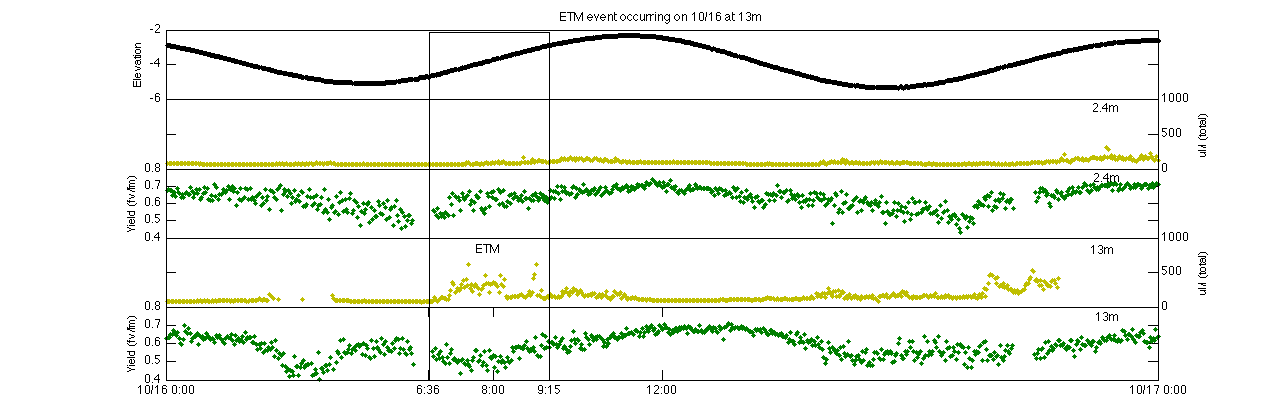
An ETM event occurring on 10/16
How do minimum fluorescence and quantum yield change vertically in the water column?
As stated previously, there is a strong relationship between minimum fluorescence, quantum yield, and tides during spring tides, while these two Phytoflash parameters are more separated from tidal forcing during neap tides. While quantum yields at 2.4m and 13m share a similar trend with regards to spring-neap cycling, the 13m depth does show greater variation and a wider range of values than at 2.4m. During spring tides at 13m quantum yield values have a mean of 0.57 but oscillate between about 0.25 and 0.75, while quantum yields at 2.4m have a mean of 0.55 but tend to remain closer to this value. Another important forcing to consider is river discharge. During this time period, river discharge is relatively low (mean of 2612 m3/s), and there is really no clear relationship between discharge and either relative fluorescence or quantum yield. Freshwater input is certainly influencing the system, however, as the mean temperature at 2.4m is 13.91*C, over a degree warmer than the mean temperature at 13m (12.82*C), signifying the warmer freshwater on top of the colder ocean water. During neap tide the water column is highly stratified, with the colder temperatures and higher salinity at 13m and warmer temperatures and fresher water at 2.4m.
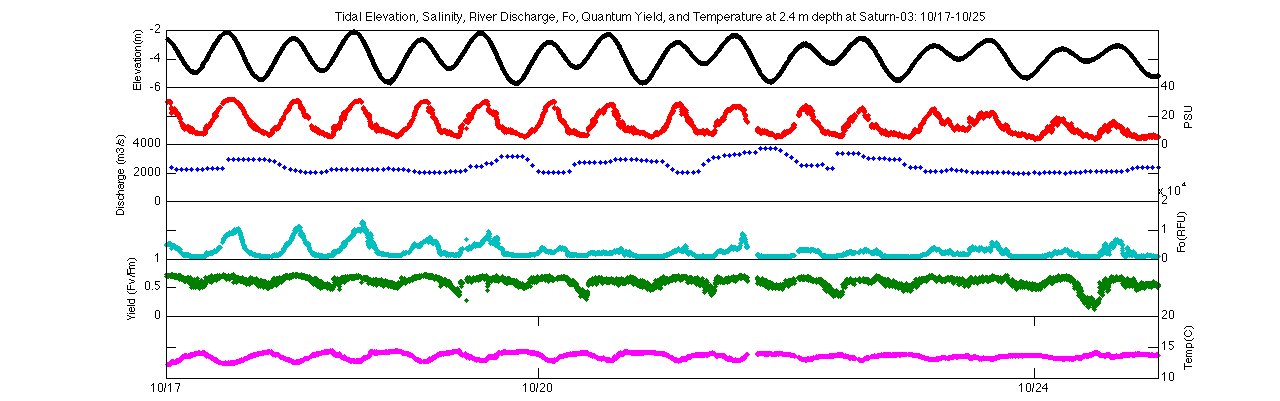

Elevation, salinity, river discharge, Fo, quantum yield, and
temperature at Saturn-03 for 2.4m (top) and 13m(bottom) during
10/17-10/25
Created by Nirzwan Bandolin & Peter Kahn
")


