You are here
The Ocean Appliance
 We provide data ingest, processing, storage, telemetry, and visualization using a single device deployed on each vessel: the Ocean Appliance.
The capabilities of the Ocean Appliance demonstrably satisfy our requirements for previous and planned experiments. Each unit can 1) ingest data in a variety of common formats, 2) communicate and share data with other appliances, 3) serve observations and model results via relevant standards, and 4) generate and serve a variety of data products and visualizations.
Read the Oceans 2007 publication on the Ocean Appliance
Telemetry
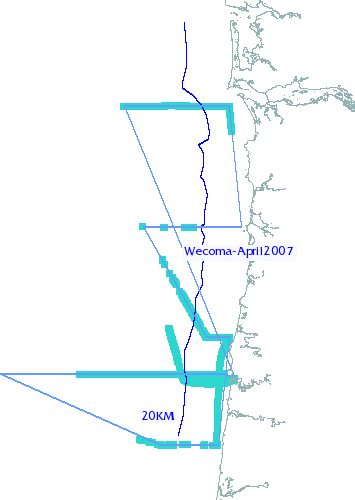 The telemetry system uses the SWAP protocol for network connectivity; the map at right shows succesful pings recorded for the R/V Wecoma during the April 2007 cruise. The blue line shows the theoretical limit of the underlying wireless protocol; we attribute successful connections outside this range to reflection off of cloud cover.
Sensor measurements stored in the appliance database is fed back to the shore and between ships via a simple subscription service. Each node subscribes to zero or more tables in the database of another node. For example, the R/V Barnes subscribes to the casts of the R/V Wecoma for offline comparisons of optical backscatter data.
The primary challenge is the intermittent availability of the network: systems must be designed to tolerate dropped connections and bursty bandwidth. Experiments are underway to test our current design for handling this unpredictable networking landscape.
The telemetry system uses the SWAP protocol for network connectivity; the map at right shows succesful pings recorded for the R/V Wecoma during the April 2007 cruise. The blue line shows the theoretical limit of the underlying wireless protocol; we attribute successful connections outside this range to reflection off of cloud cover.
Sensor measurements stored in the appliance database is fed back to the shore and between ships via a simple subscription service. Each node subscribes to zero or more tables in the database of another node. For example, the R/V Barnes subscribes to the casts of the R/V Wecoma for offline comparisons of optical backscatter data.
The primary challenge is the intermittent availability of the network: systems must be designed to tolerate dropped connections and bursty bandwidth. Experiments are underway to test our current design for handling this unpredictable networking landscape.
Visualization
The Ocean Appliance provides an assortment of dynamic, paramaterized data products, but the real strength is its extensibility: new products are easy to specify. Each product is defined as one or more parameters, an SQL query for accessing the database, and a bit of MATLAB-style code to perform the plotting. Once specified, new products are automatically published to the web and reusable in different contexts. Here are some of the products we use currently, along with examples of their data from the August 2007 cruise of the R/V Forerunner:
| A cast profile showing Oxygen (or any of several variables) against the standard salinity and temperature. | |
|
| A cast profile comparing salinity and temperature against model results. |

| Map of the dynamic feature tracking cruise plan overlaid on surface salinity. |
|
| A timeseries of cast profiles. The start and end cast can be selected. |
|
| Salinity-Temperature plot from the flow-through system. |
Data Processing Data processing involves performing a series of tasks: interpreting and parsing diverse file formats, integrating streams from multiple sensors, converting units, routine quality control, database ingest, and error handling. We model each of these tasks as a Stream Operator and compose them to handle data processing in heterogeneous environments. For example, there are five steps in the pipeline for processing CTD casts from the R/V Wecoma:
- Scan for files generated by Seabird Electronics software, the manufacturer of the CTD equipment used on all three
- Filter out casts we have already processed
- Parse the file and assign each measured quantity to a database attribute
- Output a log record
- Load the record into the database.
These steps are expressed as five chained operators implemented in Python. The resulting script is very succinct and very flexible:
  # Step 1
  scan =  Scanner(matchSeabird)

  # Step 2
  newonly = KnownCast(source=scan)

  # Step 3: mapping
  mapping = {
    'depth'        : 'pressure',
    'pressure'     : 'pressure',
    'salinity'     : 'salinity',
    'conductivity' : 'conductivity',
    'fluorescence' : 'fluorescence',
    'turbidity'    : 'OBS',
    'temperature'  : 'temperature',
    'oxygen'       : 'oxygen'
  }

  # Step 3: parsing
  cast = SeabirdCastCleaner(
      vessel='Wecoma',
      cruise='August 2007',
      instrument='wecomacast',
      mapping=mapping,
      timezone='UTC'
      source=scan,
  )

  # Step 4
  log = Log(source=cast, logifle="./wecomacast.log")

  # Step 5
  pipeline = CMOPTableInsert(source=log)

  pipeline.start()
| Attachment | Size |
|---|---|
| 559.63 KB |
")


