You are here

Blogs

Week 3

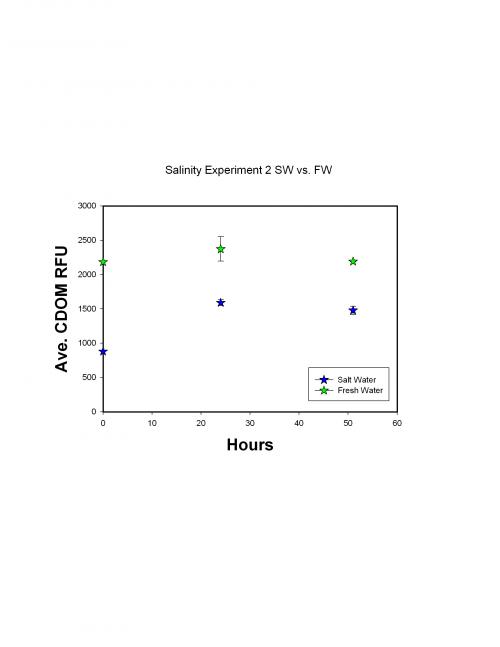
The whole lab is preparing for the cruise, pretty chaotic around here. I've been going through all of the salinity experiments and it's showing some useful information.

It seems that the CDOM levels over the days fluxed in the fresh water at the same time as salt water, although fresh water still has higher levels in all cases

Salt Water vs. Fresh Water

week 3 june 30 - july 3

This week went by really fast. On Monday we went the seminar about the Response of a Partially- Stratified Estuary to Change in River flow and Tidal Amplitude. It was pretty good, I knew a little about what the presenter was talking about from my internship last year.

Simple But Still Sweeeeet!!!


Success!!! Finally, my one of my lab methods worked. It happens to be the same one that I briefly mentioned in my previous blog but slightly alter. I worked with a spectrophotometer and compared the results when I measured the sample in a 2cm cuvette and a 200cm liquid waveguide capillary cell. The capillary cell won! It permitted more absorption to take place by allowing the sample to pass along the light source for a greater length. I presented these results in graph form on Wednesday to the other interns and the mentors so that they could critique my graph skills. On Thursday I tried another method that also failed miserably, but I have hope that trial two should show better results (or trial 3, 4, 7).

Week 4

With the holiday, this last week has been a short one and I’ve had lots of tasks to keep me busy. Things aren’t really going my way with some of samples; I’ve had to redo several PCRs to isolate the problem. I did determine that the enzyme I had been using was on the older side, so hopefully a switch to a newer tube will put an end to my problems.

gr!

Frustrations:

- electrodes that aren't packed well! (unable to reproduce procedures
- as more and more time goes on, the less sure I am the data I have produced thus far has been all that valid.
- Tons of time poured into finding out trends previously observed may be caused by other sources. Or that the trends don't exist anymore, despite that I've repeated the same procedure
- Similar results--but not quite the same! what do I make out of this? how do I interpret the data?
- an excess amount of data...I have no idea what it all means!

Week 4

This week we had to present our graphed data of what we have done so far. Bill and I decided to graph the the number of completed and failed requests the Google App Engine could complete. So we wrote a small program that would request our application repeatedly on the Google server. We did this test on two applications: one that held 100 records and another that held 7200 records. The small program we wrote was able to tell the number of failed and completed requests.

Old Man and the Sea

The R/V Wecoma research cruise in July has allowed me to come aboard to film research life on the ship. The idea is to capture the human factor about working and living at sea for 10 days. My plan is to film the research processes happening aboard the ship. Each night I will upload a short video blog to show you what we did that day. Should be fun.

Week 4 (4th of July week!!)

So this week was a crazy one! Monday was Day 1 of a protein fractionation protocol that Craig and I were going to follow for one of our sample. We have a total of four more samples which we will use this protocol on, so this week was our first run through; a "gain some experience" week. Everything was set up and ready to go on Monday morning, but the samples needed to be thawed out first. Craig came in earlier than normal and put out the samples, so by the time I arrived, the samples had been sitting out for about 1 hour. to be continued...

Thurs July 3

Today I worked most of the day sorting out what I already looked at and taking notes so as to keep separate what websites I have visited. I am looking for sites using Real Time Data-looking for curricula that uses it in the classroom. It is far and few between.

Week 3...data, data, and more data!

This week has been a week of producing more and more data! So far, its looking like I'm track with my research--Both my biogenic and synthetic MnO2 electrodes are producing different sized peaks with different concentrations of H2O2. The past couple weeks have been focussed on running cyclic and square wave voltammetry with a broad range of variables. Lately its been trying to narrow my search and to really understand what I'm looking for. Now it's a matter of controlling all the conditions for reproducible data, and identifying the different causes for the differently shaped and sized peaks. Sounds simple enough...but we'll see!

Pages

Subscribe to RSS - blogs