You are here
Week 2
We tested all of the past cruises for CDOM information it was over 250 samples all lots of information
Now we are in the process of sorting all the data and soon it will be able to be useful
-Added Later-
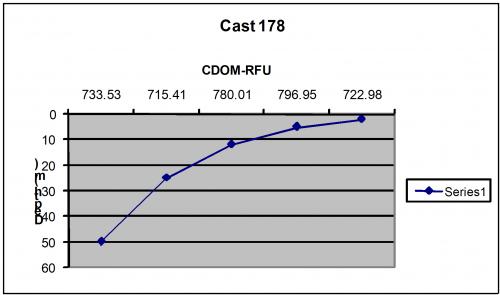
The data has been sorted by cruise, date, cast, and depth. Now I am creating graphs and looking for any trends or unusual information in the CDOM/RFU levels. So far the graphs seem to be consistent by the CDOM levels dropping as the samples are farther away from the surface.

I'm having lots of fun. Everyone in my lab is great! we all kinda help each other out with projects


