You are here
Week 4
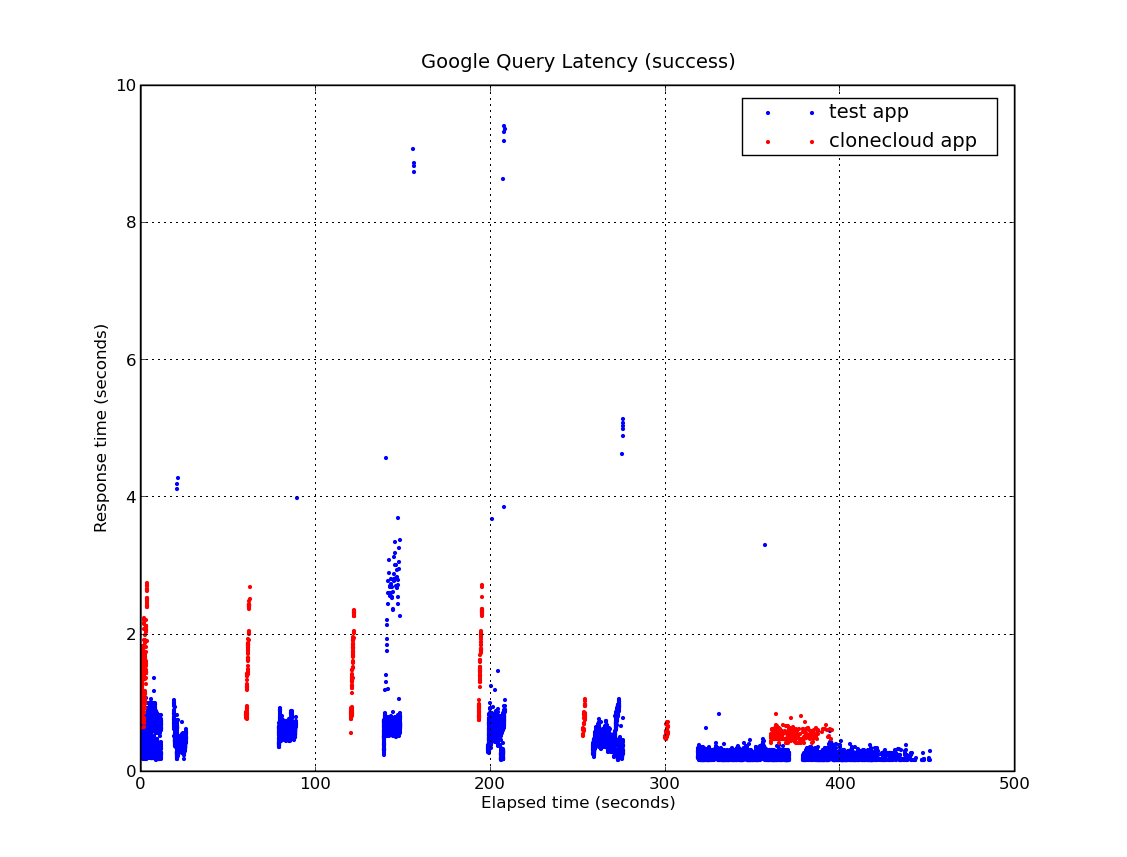
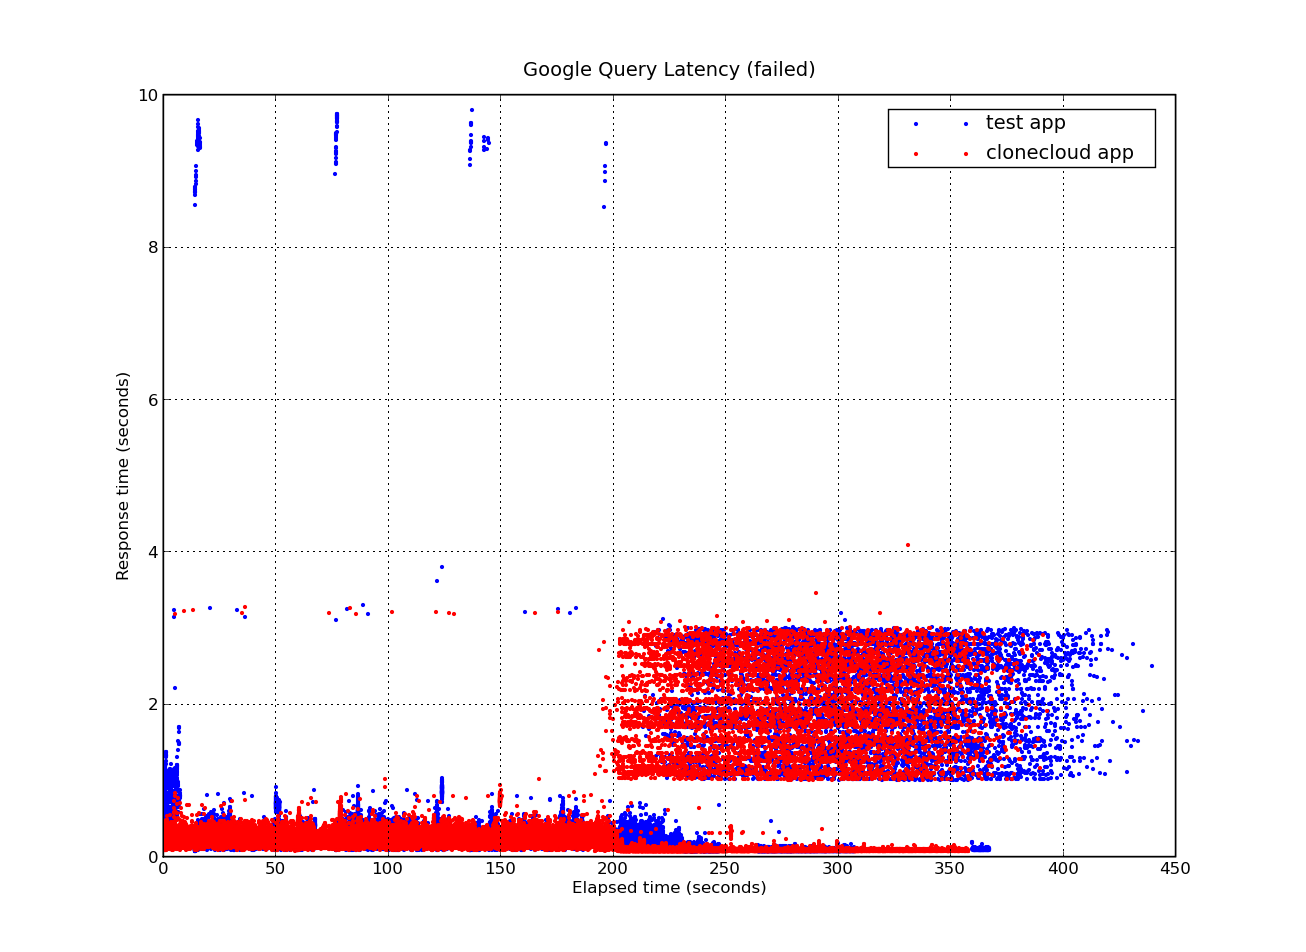
This week we had to present our graphed data of what we have done so far. Bill and I decided to graph the the number of completed and failed requests the Google App Engine could complete. So we wrote a small program that would request our application repeatedly on the Google server. We did this test on two applications: one that held 100 records and another that held 7200 records. The small program we wrote was able to tell the number of failed and completed requests.

Successes
 Failures
We were able to make many predictions as to why we got the results we did. For example, from the failures graph, we were able to guess that after 200 seconds we continued to have so many failed requests because the Google server thought we were spam bots since were making the same request over and over.
When it came time to present the data to my peers, I found it challenging to be able to explain my graphs to those who were not familiar to computer science. But with the help of my mentor i was able to convey my information clearly.


